Demosaicing
Posted on Fri 29 May 2015 in Image Processing, Digital Cameras
This article describes the basic problem of image demosaicing and a recent work of mine providing a research dataset for demosaicing research.
Image demosaicing is a procedure used in almost all digital cameras. From your smartphone camera to the top-of-the-line digital SLR cameras, they all use a demosaicing algorithm to convert the captured sensor information into a color image. So what is this algorithm doing and why is it needed?
Why do we need Demosaicing?
Modern imaging sensors are based on semiconductors which have a large number of photo-sensitive sensor elements, called sensels. When a quantum of light hits a sensel it creates an electric charge. The amount of the charge created depends on the energy of the photon which depends on the wavelength of the incident light. Unfortunately, in current imaging sensors, once the electric charge is created it is no longer possible to deduce the color of the light. (The exception is the Foveon sensor which uses a layered silicon design in which photons of higher energy levels (green and blue) penetrate into lower silicon layers than photons of lower energy levels (red)).
To produce color images current sensors therefore do not record all wavelengths equally at each sensor element. Instead, each element has it's own color filter. A typical modern sensor uses three distinct filter types, each most sensitive to a particular range of wavelengths. The three types are abbreviated red (R), green (G), and blue (B), although in reality they are remain sensitive to all wavelengths. For a detailed plot of the wavelength sensitivities, this page has a nice graph.
Each sensor element therefore records only one measurement: the charge related to a certain range of wavelengths. It does not record the full color information. To reproduce an image suitable for human consumption we require three measurements, such as red/green/blue values. (This is a simplification, and in real systems the concept of a color space is used; a camera records in a camera-specific color space which is then transformed into a perceptual color space such as Adobe sRGB.)
The most popular arrangement of color filters is the so called Bayer filter and has a layout as shown below.
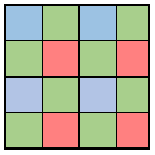
Image demosaicing is the process of recovering the missing colors at each sensor element. For example, in the top left sensel of the above figure only the blue response is measured and we need to recover the value of the green and red responses at this spatial location.
In principle, why should this even be possible? Because images of the natural world are slowly changing across the sensor, we can use color information from adjacent sensels (but different filter types) to provide the missing information.
Challenges for Demosaicing Algorithms
The above description is correct in that all demosaicing algorithms use correlations among spatially close sensels to restore the missing information. However, there are around three dozen publically available demosaicing algorithms and probably many more proprietary ones. Beside differences in resource requirements and complexity, these algorithms also differ widely in their demosaicing performance.
Without considering implementation concerns for a moment, what makes a good demosaicing algorithm? A good demosaicing method has the following desirable properties:
- Visually pleasing demosaiced output images;
- No visible high-frequency artifacts (zippering), no visible color artifacts;
- Robustness to noise present in the input;
- Applicable to different color filter array layouts (not just Bayer);
To achieve this, a demosaicing algorithm has to be highly adapted to the statistics of natural images. That is, it has to have an understanding of typical image components such as textures, edges, smooth surfaces, etcetera.
Research Dataset
One approach to image demosaicing is to treat it is a statistical regression problem. By learning about natural image statistics from ground truth data, one should be able -- given sufficient data -- to approach the optimal demosaicing performance possible.
The problem is, perhaps surprisingly, that there are no suitable datasets. Current comparisons of demosaicing algorithms in the literature resort to two approaches to provide results for their algorithms:
- Use a small set of Kodak images that were scanned onto Photo-CD's (remember those?) in the mid-1990'ies from analogue films. To me it is unclear whether this scanning involved demosaicing, and whether the properties of the analogue films are an adequate proxy for digital imaging sensors.
- Download sRGB images from the Internet and remove color channels to obtain a mosaiced image. But all these images have been demosaiced already, so we merely measure the closeness of one demosaicing algorithm to another one.
This is appalling on the one hand, but it is certainly challenging to improve on it, if only for the reason that currently no sensor can capture ground truth easily. There have been ideas to obtain ground truth using a Foveon sensor or by using a global switchable color filter and multiple captures. The first idea (using a Foveon camera) sounds feasible but the noise and sensitivity characteristics of a Foveon sensor are quite different from popular CFA-CMOS sensors. The second idea sounds ideal but would only work in a static lab setup.
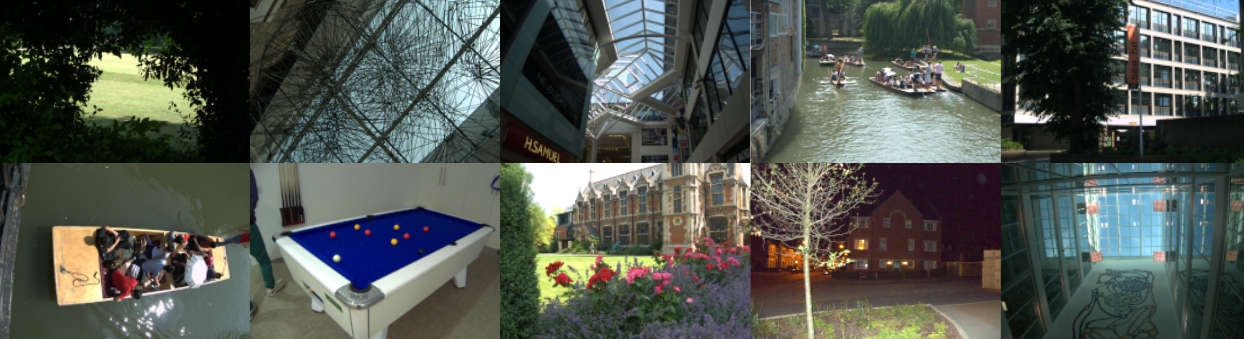
We introduce the Microsoft Research Demosaicing Dataset, our attempt at providing a suitable dataset. Our dataset is described in detail in an IEEE TIP paper. The dataset contains 500 images captured by ourselves containing both indoor and outdoor imagery. Here are some example images.
How did we overcome the problem of creating suitable ground truth images? The basic idea is as follows: it is difficult to capture ground truth for demosaicing for a full image sensor, but if we group multiple sensels into one virtual sensel then we can interpret this group as possessing all necessary color information. That is, we simultaneously reduce the image resolution and perform demosaicing. There are multiple proposals in the paper how to do this technically in a sound manner, but to see it visually, here is an example of downsampling using 3-by-3 sensel blocks on a Bayer filter.
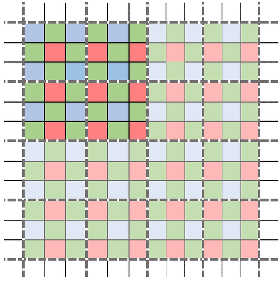
As you can see, within each 3-by-3 sensel block we may have an unequal number of measurements of each color, but the spatial distribution of sensels of different types is uniform in the sense that their center of gravity is the center of the 3-by-3 block. This is not the case in general, for example when averaging 4-by-4 blocks of Bayer measurements, then the red channels will have a higher density in the upper left corner of each block.
Algorithm Comparison
So how do common algorithms (and our novel algorithm) fare on our benchmark data set? Performance is typically measured as a function of the mean-squared-error of the predicted image intensities. The most common measurement is the peak signal to noise ratio measured in decibels (dB), where higher is better. We also report another performance measure based on a perceptual similarity metric, the structural similarity index (SSIM) which measures mean and variance statistics in image blocks, and again a higher score means a better demosaiced image.
The top algorithms achieve the following performance. I also include bilinear interpolation as a baseline method.
| Method | PSNR (dB) | SSIM |
|---|---|---|
| Bilinear interpolation | 30.86 | 0.882 |
| Non-Local means | 38.42 | 0.978 |
| Contour stencils | 39.41 | 0.980 |
| RTF (our method) | 39.39 | 0.980 |
Hence we achieve a result comparable to the state of the art. The experiments become interesting when we perform simultaneous denoising and demosaicing. Performing both operations simultaneously is desirable in a real imaging pipeline because both they happen at the same stage in the processing. For the task of simultaneous denoising and demosaicing the results tell a different story.
| Method | PSNR (dB) | SSIM |
|---|---|---|
| Bilinear interpolation | 30.40 | 0.859 |
| Non-Local means | 36.46 | 0.949 |
| Contour stencils | 37.17 | 0.953 |
| RTF (our method) | 37.78 | 0.961 |
In the paper we compare more than a dozen methods. The proposed method achieves an improved demosaicing performance of over 0.5dB in realistic conditions which is visually significant. Our method is based on the non-parametric regression tree field model (RTF) which we have published earlier; essentially this is a Gaussian conditional random field (CRF) with very rich potential functions defined by regression trees. Due to its high capacity it can learn a lot about image statistics relevant to demosaicing.
The next best method is the contour stencils method of Getreuer. This method performs smoothing and completion of values along a graph defined on the sensor positions. While the method works well it is manually defined for the Bayer pattern and may not be easily generalized to arbitrary color filter arrays.
Outlook
Demosaicing for the Bayer layout is largely solved, but for novel color filter array layouts there currently is no all-around best method. While our machine learning approach is feasible and leads to high quality demosaicing results, the current loss functions used (such as peak signal to noise ratio (PSNR) and structural similarity (SSIM)) are not sufficiently aligned with human perception to accurately measure image quality, in particular for zippering artifacts along edge structures. Whatever demosaicing method is adopted, it is beneficial to simultaneously perform demosaicing and denoising, because either task becomes more difficult if performed in isolation.